Convert 23 and Me Raw Data to VCF

DNA-Double-Helix-Ladder-300x299

Have you ever wanted to perform analysis on your 23 and Me data? Well the first step to do this consists of converting the raw output that they provide into a widely used format; in this case VCF. The VCF format enables you to use several tools to annotate each SNP with various meta information. You can use tools such as snpEff or even impute your data using the Sanger imputation server. I created an online web service that converts your raw 23 and Me data into the VCF format. It automatically detects the appropriate reference genome for you. There is also no issues with missing SNPs during the conversion process as the same reference genomes that 23 and Me use are used.

To get started, visit this page to convert your data: 23converter.tylermarrs.com.

Ranked Win Predictor

Abstract

This analysis documents the techniques involved in predicting which team will win in a ranked League of Legends game. Ranked games consist of two teams of five players that try to win by killing the opposing team's nexus. To learn more about League of Legends, follow this link.

Predicting the winner for the game League of Legends is a difficult task. There are many aspects of the game that must be considered. Player skill level, champion strength and Internet connectivity issues are just a few examples. The most accurate predictor to date is the summed total of each team's players champion win rate.

Methods

Introduction

Riot Games' League of Legends API was used to collect data for this analysis. The API provided endpoints for fetching player information, player match history and detailed match information. In addition, Weka was used for data analysis and the creation of the predictive model. Several methods were used prior to the one discussed in this article, however they were left out for brevity.

Data Collection

Approximately 1,000 games from each League of Legends ranking system (bronze through challenger) was collected for training and testing the model. Data collection consisted of querying the API for players from each rank and finding that player's previous 20 matches. In some cases more data was collected than others. For example, there are significantly more players in the bronze tier than the challenger tier. 

While querying the API for each match, several sub-API calls were made to obtain each player's win rate for that champion. Once each player's win rates were collected, the totals were summed for each team. In the event that a player has less than 10 games on that particular champion; a win rate of 50% was assigned. Each team's total win rate never exceeds 500 percent (5 players per team with a maximum of 100% win rate per player).

A single entry would look like the following:

BlueTeam RedTeam Winner
385 407 red

Data Analysis

Initially, the data analysis process consisted of training and testing the model from the higher ranked match data (masters and challenger) using Weka. A number of different algorithms were used in the model: decision trees, baysian network and rule based. After testing all of the different models, the J48 decision tree algorithm performed the best (with adjustments to pruning etc).

Here are the J48 options used:

weka.classifiers.trees.J48 -R -N 5 -Q 1 -B -M 2 -A

With these options and using the challenger data set the model was able to successfully predict 90% of the games correctly. Testing the model against lower ranked matches showed that the model became more accurate when testing against lower tier data. For example, the master tier has an accuracy of 94% and the lowest tier (bronze) has an accuracy of 98%.

Predictive Model Implementation

The output from the Weka J48 decision tree algorithm was implemented in the Go programming language. You can see the full implementation below.

package classifiers

/*
=== Run information ===

Scheme:weka.classifiers.trees.J48 -R -N 5 -Q 1 -B -M 2 -A
Relation:     team_win_rates_masters2
Instances:    3304
Attributes:   3
              BlueTeam
              RedTeam
              Win
Test mode:user supplied test set:     641instances

=== Classifier model (full training set) ===

J48 pruned tree
------------------

RedTeam <= 285.871643
|   BlueTeam <= 253.400162
|   |   RedTeam <= 258.712128
|   |   |   BlueTeam <= 229.873032: RedTeam (33.0/5.0)
|   |   |   BlueTeam > 229.873032: BlueTeam (38.0/13.0)
|   |   RedTeam > 258.712128: RedTeam (146.0/10.0)
|   BlueTeam > 253.400162
|   |   RedTeam <= 245.268372: BlueTeam (556.0/6.0)
|   |   RedTeam > 245.268372
|   |   |   BlueTeam <= 302.380981
|   |   |   |   BlueTeam <= 265.680847: RedTeam (53.0/18.0)
|   |   |   |   BlueTeam > 265.680847: BlueTeam (262.0/90.0)
|   |   |   BlueTeam > 302.380981: BlueTeam (286.0/18.0)
RedTeam > 285.871643
|   BlueTeam <= 284.519928: RedTeam (954.0/50.0)
|   BlueTeam > 284.519928
|   |   RedTeam <= 316.890594: BlueTeam (196.0/62.0)
|   |   RedTeam > 316.890594
|   |   |   BlueTeam <= 324.080078: RedTeam (101.0/6.0)
|   |   |   BlueTeam > 324.080078
|   |   |   |   BlueTeam <= 344.303864
|   |   |   |   |   RedTeam <= 330.416656: BlueTeam (7.0/2.0)
|   |   |   |   |   RedTeam > 330.416656: RedTeam (7.0)
|   |   |   |   BlueTeam > 344.303864: BlueTeam (5.0)

Number of Leaves  :     13

Size of the tree :  25


Time taken to build model: 0.03 seconds

=== Evaluation on test set ===
=== Summary ===

Correctly Classified Instances         603               94.0718 %
Incorrectly Classified Instances        38                5.9282 %
Kappa statistic                          0.8814
Mean absolute error                      0.1043
Root mean squared error                  0.2121
Relative absolute error                 20.856  %
Root relative squared error             42.3594 %
Total Number of Instances              641

=== Detailed Accuracy By Class ===

               TP Rate   FP Rate   Precision   Recall  F-Measure   ROC Area  Class
                 0.956     0.075      0.927     0.956     0.942      0.975    BlueTeam
                 0.925     0.044      0.955     0.925     0.94       0.975    RedTeam
Weighted Avg.    0.941     0.059      0.941     0.941     0.941      0.975

=== Confusion Matrix ===

   a   b   <-- classified as
 306  14 |   a = BlueTeam
  24 297 |   b = RedTeam
*/

// This classifies which league of legends team will win based on the
// summation of each player's specific champion win rate for their team.
// This is the implementation of the J48 decision tree's output. Overall this
// classifier has an accuracy of rougly 92%.
// The output of this classifier is a string of "blue" or "red".
func CWRWinningTeamClassifier(blueWinRate float64, redWinRate float64) string {
    var winner string
    if redWinRate <= 285.871643 {
        if blueWinRate <= 253.400162 {
            if redWinRate <= 258.712128 {
                if blueWinRate <= 229.873032 {
                    winner = "red"
                } else {
                    winner = "blue"
                }
            } else {
                winner = "red"
            }
        } else {
            if redWinRate <= 245.268372 {
                winner = "blue"
            } else {
                if blueWinRate <= 302.380981 {
                    if blueWinRate <= 265.680847 {
                        winner = "red"
                    } else {
                        winner = "blue"
                    }
                } else {
                    winner = "blue"
                }
            }
        }
    } else {
        if blueWinRate <= 284.519928 {
            winner = "red"
        } else {
            if redWinRate <= 316.890594 {
                winner = "blue"
            } else {
                if blueWinRate <= 324.080078 {
                    winner = "red"
                } else {
                    if blueWinRate <= 344.303864 {
                        if redWinRate <= 330.416656 {
                            winner = "blue"
                        } else {
                            winner = "red"
                        }
                    } else {
                        winner = "blue"
                    }
                }
            }
        }
    }
    return winner
}

Conclusion

In conclusion, the best predictor for determining the winner of ranked League of Legends games seems to be the champion win rate. Using the model at any rank gives a very accurate prediction of 90% to 98%. If you are interested in using this implementation, then please visit loldestiny.tylermarrs.com.

Challenger Tier Baron Throw Analysis

Abstract

This is a data analysis exercise to answer the question of: Which region throws the most at baron? If you are not familiar with the game, League of Legends, it is a Multiplayer Online Battle Arena (MOBA). In short, the game consists of two teams that try to destroy one another's nexus. Each team consists of five players and each player gets to choose a champion to play as.


Figure 1. Baron Nashor
Source leagueoflegends.com

Although destroying the nexus is the winning objective, there are many small objectives within the game. Some of these objectives consist of killing monsters. Baron Nashor (Figure 1) is the toughest monster to kill within the game and on occassion poor choices by players causes a Baron Throw. A Baron Throw can be defined as a poor choice in an attempt to kill Baron Nashor that causes your team to die. Within my analysis I found that there is not a major difference between the challenger players within different regions. However, there is enough of a difference to show that some regions do throw at baron more than others by a small margin.

Methods

Introduction

Riot Games' League of Legends API was used to collect data for this analysis. The API provided endpoints for fetching challenger players, summoner matches and match information. The overall process consisted of fetching data from the API, classifying matches for Baron Throws and finally visualization of the data.

Data Collection

Several scripts were created in the process of collecting the data. Snakemake, a Python workflow engine, was used to help streamline the process. The benefit to using Snakemake is that it enables you to resume the workflow from where it left off in the event of a software bug, power outage or hardware failure. Be aware that Snakemake is not magic. You must create your data pipeline in a way that it can be resumed in the event of a failure.

baron throws data pipeline
Figure 2. Snakemake Data Pipeline

The first step was to query for the players within the challenger tier for all 11 regions (Table 1). As of the year 2016, each region contains 200 challenger tier players. Analyzing every match that a player has participated in would be exhaustive. For example, some players started playing the game when it was first created in 2009. Assuming the player only played on that account, it could be thousands of games to analyze. To narrow down match history, the matches played during the 2016 season were collected for each player. On average this consisted of 335 games per player.

Table 1. Regions
Region Code
Brazil BR
Latin America North LAN
Oceania OCE
Turkish TR
Latin America South LAS
Russia RU
European Union West EUW
Japan JP
Korea KR
North America NA
European Union Northeast EUNE

The longest process in the data pipeline is during the match fetching phase. This is due to the massive number of API requests that need to be made; one for each match. Approximately 750,000 API calls to fetch match information was required. During each API call consideration of rate limiting and service instability must be handled. Once the match is fetched it is classified as a Baron Throw or not and written to a flat file so that it can be aggregated for data visualization. Data aggregation consists of grouping each player's matches from each region to determine the number of Baron Throws that occurred within their match history. The Baron Throw rate is a simple division of Baron Throws / matches played. Furthermore each aggregated result is dumped in JSON format and uploaded to the web server so that it can be visualized. The web page makes use of a JavaScript plotting library; Plotly.js.

Baron Throw Classification

In order to determine if a baron throw really occurred, time series analysis and positional analysis was required. Without positional analysis it would be difficult to know for sure if a Baron throw really occurred. This is due to the location of Baron being relatively small compared to the entire game map. So only looking at deaths within the timeframe of the Baron kill event may not be very accurate.

Baron zone
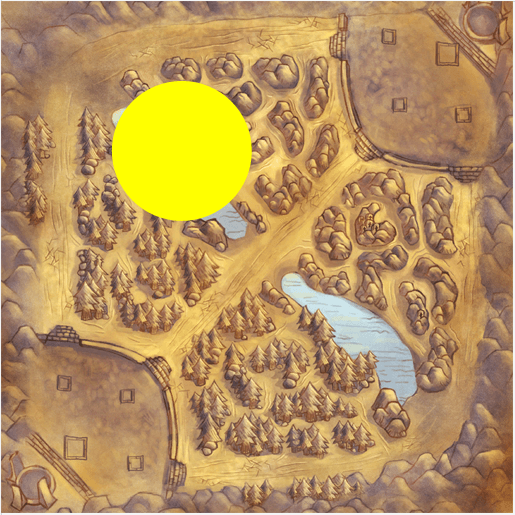
Figure 3. Summoner's Rift Baron Throw Zone

The match data provided by Riot includes events within the form of a time series and XY coordinates of where the event occurred. Purely analyzing kill events within a given time span is not sufficient to determine if a Baron Throw event occurred. For example, a small group of players could be killed at the bottom right corner of the map while baron was taken successfully by other players. To make the classifier as accurate as possible, a radius around Baron Nashor was created (Figure 3) and used to determine if player deaths coincided within this area. Since Baron Nashor does not spawn until 20 minutes into the game, the search space could be narrowed down to all events after 20 minutes. Once a Baron Nashor kill event was found, events within a 30 second period before and after is analyzed for player deaths. If 4 or 5 players were killed on the same team within the baron zone and within the thresholds of 30 seconds before the baron event or 30 seconds after the baron event, a Baron Throw occurred. Figure 4 shows the classification algorithm in pseudocode form.

BARON_X = 5007
BARON_Y = 10471
BARON_R = 1947

function inBaronZone(x, y)
 distance_x = BARON_X - x
 distance_y = BARON_Y - y
 square_dist = (distance_x * distance_x) + (distance_y * distance_y)
 square_r = BARON_R * BARON_R

 return square_dist <= square_r
end

function hasBaronKills(match)
  match.BaronKills > 0
end

function playerTeam(match, summoner_id)
  return blue or red accordingly
end

KillEvent class {
  KillerID integer
  ParticipantID integer
  X integer
  Y integer
}

BaronEvent class {
  FrameIndex integer
  Time integer
  KillerID integer
  KillEvents array
}

function isBaronThrow(match, summoner)
  if not hasBaronKills(match)
    return false
  end

  baron_events = array
  for each index, timeline event
    if timeline event < 20 minutes
      continue
    end

    if timeline event == baron kill
      create baron event instance with values
      add baron event to baron_events array
    end
  end

  player_team = playerTeam(match, summoner_id)

  // Look at one frame before and after the baron event for kills
  for each baron_events
    for each timeevent in range of baron_event.FrameIndex -1 to baron_event.FrameIndex + 1
      if kill event and event 30 seconds before baron or 30 seconds after baron
        create kill event instance with values
        add kill event to baron event
      end
    end
  end

  is_throw = false
  for each baron_events
    blue_deaths = 0
    red_deaths = 0
    for each baron_event.kill_events
      if inBaronZone(kill_event.x, kill_event.y)
        if kill_event.ParticipantID is blue team
          add 1 to blue_deaths
        else
          add 1 to red_deaths
        end
      end

      if player_team == blue && blue_deaths >= 4 or player_team == red and red_deaths >= 4
        is_throw = true
        break from loop
      end
    end
  end
  return is_throw
end

Figure 4. Baron Throw Classifier Pseudocode

Conclusion

Challenger tier baron throws by region
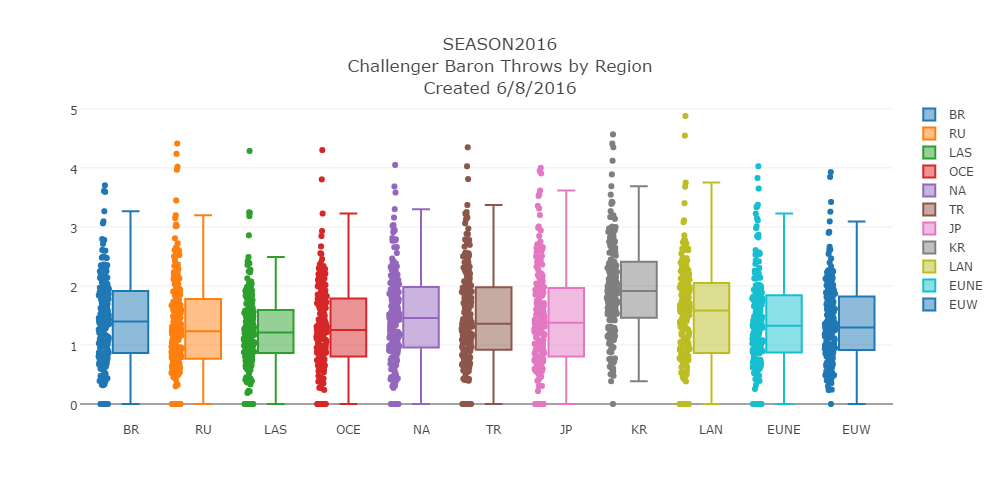
Figure 5. Challenger Throw Rate by Region

While a significant margin is not illustrated in Figure 5, a small difference of Baron Throws is observed across each region. Korea shows the highest median rate of 1.9% for baron throws and Latin America South shows the lowest rate of 1.23% for Baron Throws. The region in which a player plays League of Legends does not seem to be correlated with the Baron Throw rate. The small differences amongst regions may indicate the importance placed on Baron Nashor between these regions, however further analysis would need to be performed. A better observation for Baron Throw analysis could consist of comparisons amongst player ranks within each region. The player rank, according to Riot, illustrates the skill level of a player. Analyzing the throw rate of a player in the lowest tier, bronze, against the highest tier, challenger, should show a significant difference.

To see up to date and more graphs at the regional level, please visit lolstats.tylermarrs.com/baronthrows.

Contents © 2020 Tyler Marrs